Pie Chart#
The Pie Chart widget displays circular graphs. It supports tooltips or the ability to highlight individual segments, allowing for a detailed examination of the data.
Starting Widget Configuration#
To configure the widget, click on the edit icon 
A popup window "Widget Settings" will open:
.png)
Fill in the necessary fields to configure the widget.
General Fields#
- “Widget Name *” – a text field that is filled in manually using the keyboard;
- “Mode” – a dropdown list where you need to select the query creation mode for the widget:
| Name | Description |
|---|---|
| Builder Mode | Allows you to build a query from separate blocks. Each block (Table Join, Filters, Widget Series, Group By, Sort, Row Count) has the option to configure the necessary commands for working with data, arithmetic and logical commands, comparison operators. |
| Advanced Mode | Allows you to manually enter a query in the SQL field: |

- “Tables” – a dropdown list with all available database tables.
Additional Fields Available for Configuration Only in Builder Mode#
Table Join#
Table joining is necessary to extract data from multiple related tables and form more complete and informative results.
To compare two tables for subsequent joining, the following operators are used:
| Name | Description |
|---|---|
| = | Returns rows from both tables where the values in the specified columns are equal. |
| != | Returns rows from both tables where the values in the specified columns are not equal. |
| > | Returns rows where the value in the specified column from the first table is greater than the value in the specified column from the second table. |
| < | Returns rows where the value in the specified column from the first table is less than the value in the specified column from the second table. |
If you need to join only 2 tables, you must fill in the fields:
- “Column” from the dropdown list;
- “Operator” from the dropdown list;
- “Column 2” from the dropdown list;
For example,

If you need to join more than two tables, you must click the button 
If you need to delete a table join, you must click the button 
Filters#
Filters allow you to set conditions for the selected data using comparison operators and logical operators.
To set one condition, you need to fill in the fields:
- “Column” from the dropdown list;
- “Operator” from the dropdown list;
- “Value” manually using the keyboard;
For example,

If you need to combine several conditions into one, for example, ((robots.is_deleted = 0) AND (robots.id > 13)), you need to use logical operators. To do this, select the desired operator by clicking on the icon 


If you need to set a complex condition for the Filter, including several parentheses, you must click the button 
If you need to delete a condition, you must click the button 
Widget Series#
Widget series are used to specify the data columns that need to be extracted from the database. They determine which data will be returned in the query results.
To configure the Widget Series, you need to fill in the fields:
- “Column” from the dropdown list;
- “Operator” from the dropdown list;
- “Series Name” manually using the keyboard;
For example,

If you need to display additional data on the legend, you should click the button 
Group By#
Field for configuring the process of merging rows of data with the same values in a specific column (or columns) into a single set, allowing for aggregate operations on these groups. To merge rows of data, you need to fill in the column field from the dropdown list;
Sorting#
Fields for configuring the process of ordering data in the resulting set in a specific order based on the values in one or more columns. To sort in ascending order, you need to enter "ASC" in the "Sort By" field. To sort in descending order, enter "DESC". Then you need to fill in the "Column" field from the dropdown list;
Row Count#
The field is filled in manually using the keyboard or with the counter 
Testing#
To ensure that the query is set up correctly, you need to click the button 
To display the Dashboard on the panel, click the "OK" button.
To delete all filled data, click the "Cancel" button.
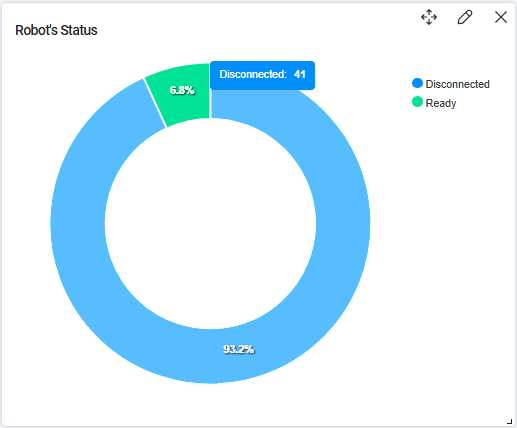
Example:

To display Robot statuses on the Pie Chart Dashboard, you need to enter the data in the corresponding fields in the "Widget Settings" window:
Builder Mode (Example)#


You need to fill in the fields:
Tables *
robots
robot_statuses
Table Join
| Column | Operator | Column 2 |
|---|---|---|
| robots.status | = | robot_statuses.code |
Filters
| Column | ||
| robots.is_deleted | = | 0 |
Widget Series
| Column | Series Name | |
| robots.status | COUNT | |
| robot_statuses.description |
Group By
robots.status
Row Count
1000
Advanced Mode (Example)#
You need to fill in the field:
SQL
SELECT
	count(robots.status) AS count,
	robot_statuses.description AS name
FROM
	robots LEFT JOIN robot_statuses
	ON robots.status=robot_statuses.code
WHERE
	robots.is_deleted=0
GROUP BY
	robots.status
LIMIT 1000