Deployment Diagram#
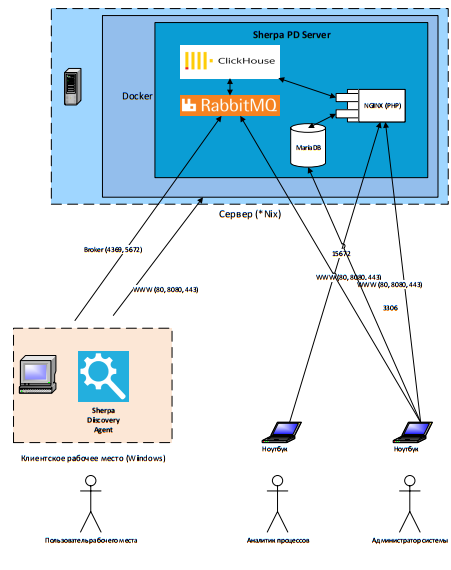
You can download it in good quality here:
The diagram describes the implementation of functionality at a high level, which uses artificial intelligence capabilities to identify business processes that are most suitable according to specified criteria for subsequent robotic automation. The collection of all necessary information on user activities, its processing, and analysis are performed in the background, without distracting personnel from their main activities. The actions of individual users are analyzed at a detailed level, by specific steps (clicks, transitions, etc.).
Type of Collected Data#
The type of collected data is a screenshot/metadata for each user action (screenshot for each user action). Detailed metadata includes:
- Application name
- Username
- Event type (e.g., mouse wheel, left mouse click)
- Mouse position (e.g., x: 933, y:637)
- Timestamp
Control is provided over which business applications should be monitored, using lists that define applications for monitoring. Any applications not approved for detection for security or other reasons can be excluded from the inclusion list or added to the exclusion list. Upon request, masking of collected text information can be applied based on a specified list of regular expressions.
Installation and Configuration#
All components of Sherpa Process Discovery are installed locally within the client's environment, without connection to external servers or SaaS services.
All data is stored in the internal storage of the discovery server and is not transmitted or exported outside the server, either automatically or manually. By default, the deployment of the Process Discovery Server is carried out using a Docker container.
The deployment of Sherpa Discovery Agents on user workstations is performed manually using an exe installer or automatically using an msi installer, through the GPO mechanism.
Logging#
Monolog is used for logging. Audit events and system errors are saved in a dedicated database table.